A reminder that lands three times out of four sounds like a solved problem, right up until you look at what happens after the first one gets ignored. In my Claude Code sessions the next reminder after a followed one landed 76% of the time. After an ignored one, 18%. Same hook, same session, and no error, no exit code and no log line reported the difference.
This is the failure mode after the obvious one. I have already written about the Claude Code hook that fired 574 times and blocked nothing, which is the dead-gate case: a hook that never acts at all. This post is about the harder half. These hooks work. They fire, they land, and then they stop landing in runs, and every instrument I had said they were fine.
Across 47,609 log rows from my own system: reminder compliance is path-dependent, 76% after a hit and 18% after a miss, a 4x gap that held across every specification I tried. Only 3.5% of the prompt events my hooks see are human. My retrieval returned week-old results 99.8% of the time. And a redaction guard passed 43 tests while 11 prompts were recoverable from its output.
Why Claude Code hooks fail quietly
Claude Code hooks fail quietly because failure has no channel. A hook returns an exit code, and an exit code describes the process, not the effect. So a hook that fires perfectly and gets ignored looks exactly like a hook that fires perfectly and works.
That gap is currently being discussed on Anthropic's own tracker, where a proposal to replace shell hooks with typed TypeScript functions is open. One commenter running 42 hooks reports that 35 of them cannot emit a non-zero exit at all, and that he wrote a second scheduled job to grep his own log files because exit status certifies nothing. Another, with 55 hook scripts, keeps a SessionStart check whose only job is to prove his other guards are still connected.
Typed returns would fix "did it run". They do not fix "is anyone still listening", and those are different problems.
The session hooks and context routing I measured all of this against live in primeline-ai/evolving-lite. The audit at the end is what I now run against them.
What I counted
Four ledgers from my own live system, recounted the day I published this, none quoted from memory.
| Ledger | Rows | Window |
|---|---|---|
| Stop-gate observations | 3,885 | 2026-06-05 to 2026-09-04 |
| Hook compliance | 10,273 | 2026-05-12 to 2026-09-04 |
| Retrieval lookups | 32,614 | |
| Tool-slate fires | 837 | |
| Total | 47,609 |
Four findings came out, and each one is a question I could not answer about my own setup until I looked.
Does one ignored reminder cost you the next one?
Yes, by a factor of four. One of my hooks reminds me to check my knowledge base before answering. I joined every fire to what happened next in the same session, then split those by whether the previous fire in that session had landed.
| Previous fire in the session | Next one followed |
|---|---|
| Was followed | 84 of 111 = 76% |
| Was ignored | 22 of 124 = 18% |
303 observable injections across 68 sessions. A permutation test that shuffles outcomes while preserving each session's length puts that 58-point gap at p below 0.0001.
The effect held every way I sliced it. I varied the window for counting a follow-up between 10 and 60 minutes, and I varied whether fires with no observable follow-up count as a miss or get dropped. Six specifications, gap ratios between 2.2x and 4.3x, same direction every time.
Compliance is a state, not a rate. Once a session starts ignoring a hook it mostly keeps ignoring it, so an aggregate percentage across all fires describes neither half. The lever is not making the hook louder. It is not spending the fire in the first place unless it earns the interruption.
The number that died on the way here
I owe you the version of this post I did not publish. In August I measured the same hook by position in the session and got a clean decline: 92% on the first reminder of a session, 31% by the sixth, across 221 cases. It is a better headline than the one above and I had it in the title.
Then I re-derived it on four months of data instead of one snapshot.
| Specification | 1st fire | 6th and later |
|---|---|---|
| 10-min window, unobservable dropped | 63% | 46% |
| 10-min window, unobservable as miss | 14% | 25% |
| 30-min window, unobservable dropped | 39% | 47% |
| 60-min window, unobservable dropped | 34% | 47% |
The decline shows up in exactly one of six specifications, and that one drops 371 of 674 fires as unobservable. Change that single choice and the gradient reverses.
A finding that flips sign on one analysis choice was never a finding.
The path-dependence result in the previous section is the one that survived the same treatment. I am leaving both in because the useful part is not either number. It is that I would have shipped the dead one if I had not re-run it, and the only reason I re-ran it was that it had become load-bearing enough to be in the title.
This lives in primeline-ai/evolving-lite - the self-evolving Claude Code plugin. Free, MIT, no build step.
What is the right fire rate for a Claude Code hook?
Not the number you think. The failure I can actually demonstrate is the loud one, and it is worse than any rate suggests.
A saturation monitor in my system has run 2,720 times since June. Every single run reported at least one finding, 5,465 finding instances in total. Deduplicated, those are two distinct findings: one appeared 5,440 times and the other 25. It has been telling me the same two things for three months and I have been ignoring all of it.
That is the shape to look for. Not "how often does it fire" but "how many different things has it ever said". A monitor with a 1,360-to-1 repeat ratio is a stuck bit with a timestamp.
I also had a rate number here that did not survive the recount. I had written that one of my hooks fired on 0.9% of edits and produced 11 rows in three weeks, as the too-quiet counter-example. Recounted over two months against 3,308 Edit and Write calls, it has written 115 warnings across 44 sessions, which is 3.48%. It is not too quiet at all. What it does do is warn every time and block never, which is a different problem and belongs to the dead-gate post.
So I no longer have a demonstrated too-quiet failure, only a demonstrated too-loud one. And 166 of my 303 observable reminders were the sixth or later fire in their session, which is a lot of credibility spent in sessions that had already stopped listening.
There is a related trap in threshold tuning. My strictest gate carries a naive rule and a narrowed rule. Over the same 3,885 events the naive rule would have flagged 99.1% of turns and the narrowed one 5.2%. There is no useful setting in between, because the thing it tries to detect is not reliably present in the text it reads. If loose is noise and tight is silence, stop turning the dial and change what you read.
Do your Claude Code hooks know who is human?
Most of what a Claude Code hook sees is not a person typing. I walked 1,724 transcripts and filtered step by step. Out of 52,020 user records, 1,803 were a human at a keyboard. That is 3.5%, and two runs came out byte-identical.
| Filter step | Records left |
|---|---|
| All user records | 52,020 |
| Has text | 5,622 |
| Not a sidechain | 5,622 |
| Not meta | 4,627 |
| No machine marker | 2,539 |
| Not agent-originated | 2,539 |
| Not an SDK prompt | 1,803 |
Everything else is subagent briefs, command bodies and task notifications. My matcher hit that machine text several times more often than anything I typed. It was recommending tools to a robot.
The scorer had a second problem I would not have guessed. Its keyword list was written in English. I write in German.
| Measure | Value | Share |
|---|---|---|
| Rows | 10,273 | |
| Scored exactly 0 | 6,131 | 59.7% |
| Actually injected | 1,083 | 10.5% |
| Median prompt length | 144 characters |
It structurally could not see most of what I typed, while agent output full of the right English nouns scored high. Two lines of jq would have told me that in May. If you run any prompt-scoring hook, count what share of its input is human before you tune anything else.
When did your memory last return zero?
Out of 32,614 lookups, 32,254 returned exactly three results. Zero came back 348 times, of which 327 were crashes. That leaves 21 genuine empty results, 0.06%, every one on a single out-of-vocabulary identifier.
That reads like success. It means the system has no way to tell me it looked and found nothing relevant. Its vocabulary is "here are three things" or "I crashed", with no third state, and a missing state gets encoded into one of the other two.
What those three things were is the part that cost me. I measured the age of what came back: 99.8% of it was under a week old, against a base rate of 11% in the store.
- -Searches the whole store
- -Ranks by how well it matches
- -Returns nothing when nothing fits
- -Age is a tiebreak at most
- +99.8% of hits under 7 days old
- +Recency bucket is the primary sort
- +Match strength only breaks ties inside a bucket
- +About 7% of the corpus could ever compete
It was not searching. It was handing me last week. My memory system post covers how that layer is built, and this is what happens when nobody measures it afterwards. The check takes two minutes: pick a query whose single best answer you already know, make sure that answer is old, and see whether it comes back in the top three.
Can your guard fail?
If you cannot name an input that makes your guard fail, you do not have a guard. I could not, twice in a row, on the same file, and it cost me two data leaks in one week.
I wrote a small script to label training data for a tool-suggestion feature. One hard rule: never persist prompt text. Store a hash prefix, a length, and derived tokens. Then I pointed three agents at it with one instruction: refute this, and reproduce whatever you find.
Version 1 stored the tokens in first-appearance order. I had argued in the docstring that single tokens cannot be reassembled. True of a bag. False of an ordered list.
| What came back out | Count |
|---|---|
| Rows carrying 4 or more ordered terms | 1,436 of 1,803 |
| Rows yielding a recoverable phrase of 4+ words | 1,181 |
| Distinct prompts recovered character for character | 69 |
Thirty of thirty tests green, plus a full code review on the same file that came back clean.
The three stored fields cooperated. The terms gave the content words in order, the character count pruned the candidates, and the hash prefix confirmed the guess. A hash stored next to enough structure to enumerate candidates is not redaction. It is an oracle.
The guard I had written for exactly this searched the file for a space-joined run of words. The writer serialises each term as its own quoted JSON string, so the space-joined form can never appear there, whatever the list contains. The assertion was unfalsifiable by construction.
Version 2 was my fix: salted, sorted hashes. It was refuted with a rainbow table rather than an argument. The salt was a constant in the same file, the tokeniser emits a small vocabulary, the length field pins the candidates, and the hash prefix still confirms.
| Attack set | Result |
|---|---|
| 26 authored prompts | 22 recovered exactly |
| 900 real rows | 4,672 of 11,366 hashes inverted |
| Same 900 rows | 11 prompts recovered exactly, and that is a floor |
Forty-three of forty-three tests green at that moment.
Here is the part I would most want another developer to take. I had verified version 2 myself. I re-ran the attack that worked before, got zero, and wrote that the leak was closed and measured rather than argued. My probe could only find the attack I had already seen, which is the exact shape I had criticised in version 1, committed by me, twenty minutes later.
Version 3 does not store the tokens at all. A row carries a count. Forty-eight tests, 1,809 rows, zero hashes anywhere in the output.
And the measurement that proved the whole suite was blind: deleting the leaking field outright left all 43 tests green. Not one test asserted what a row may contain.
A guard on the shape catches the next leak by construction. A guard on the content only catches the one you thought of.
Both leaks were a field that should not have been in the row, not a bug in a computation, and each slipped past a guard written against the previous imagined attack. What held in the end was not a stronger hash. It was an allow-list of permitted fields, checked at write time.
What I changed
Three changes moved real numbers, and none of them was a new hook.
The retrieval was asking the wrong question. My per-call lookup built its query out of the surrounding narration rather than out of the tool call it was attached to. Share of query terms actually present in that call's own input: 0.122. After the change: 1.000, on a pre-registered gate of 50 held-out calls, 50 of 50.
It never returned a knowledge node, only past experiences. Before, 0 nodes on 723 logged calls. After, 7 of 7, with distinct ids each time.
And it can now say that nothing fits. Every row carries an explicit state, and the honest one gets used. Live, over the first 63 rows: 55 fired, 5 machine text, 3 nothing new. On the tool-suggestion half, 56 of 63 rows said "no tool fitted". That reads like failure and is the opposite. The same component previously had two vocabularies. Now it declines out loud, and a decline is a fact I can act on.
The cost, stated plainly: 32 of my 41 tools carry a usable "when to reach for this" line, 6 do not, 3 are hand-written. Coverage is not the bottleneck. The suggestion still only fires on about 9% of prompts where no tool was named, and I do not yet know whether that is correct restraint or a broken matcher. The run that would have told me was stopped, because its dataset was the one that leaked.
The audit you can run in ten minutes
Seven questions, in the order that found the most in my own setup.
- Does the previous outcome predict the next one? Join each fire to what happened next, then split by whether the fire before it landed. Mine: 76% against 18%.
- How many different things has it ever said? Deduplicate its findings. Mine ran 2,720 times and produced 2 distinct results.
- What share of its input is human? In my transcripts, 3.5%.
- How many human prompts score zero? If your scorer has a keyword list, check what language it is in.
- Does your log have a denominator? If a non-fire writes nothing, you cannot compute a rate and you cannot tell suppression from absence.
- When did retrieval last return nothing? Run a query whose best answer is old and see if it survives.
- Can this guard fail? Delete the thing it guards against and re-run the tests. If they stay green, the guard is decorative.
Three of those are one line each. Run them against your own machine:
# 2. Is enforcement behind a flag nobody set?
grep -o '"[A-Z_]*ENFORCE[A-Z_]*"' ~/.claude/settings.json | sort -u

# 3. What share of your hook's input is a human?
cat ~/.claude/projects/*/*.jsonl \
  | jq -r 'select(.type=="user") | .message.content | strings' \
  | grep -cv '<'

# 5. Does your hook log have a denominator?
# Compare this against your prompt count, never against itself.
wc -l < your-hook.jsonl
The Hook Audit
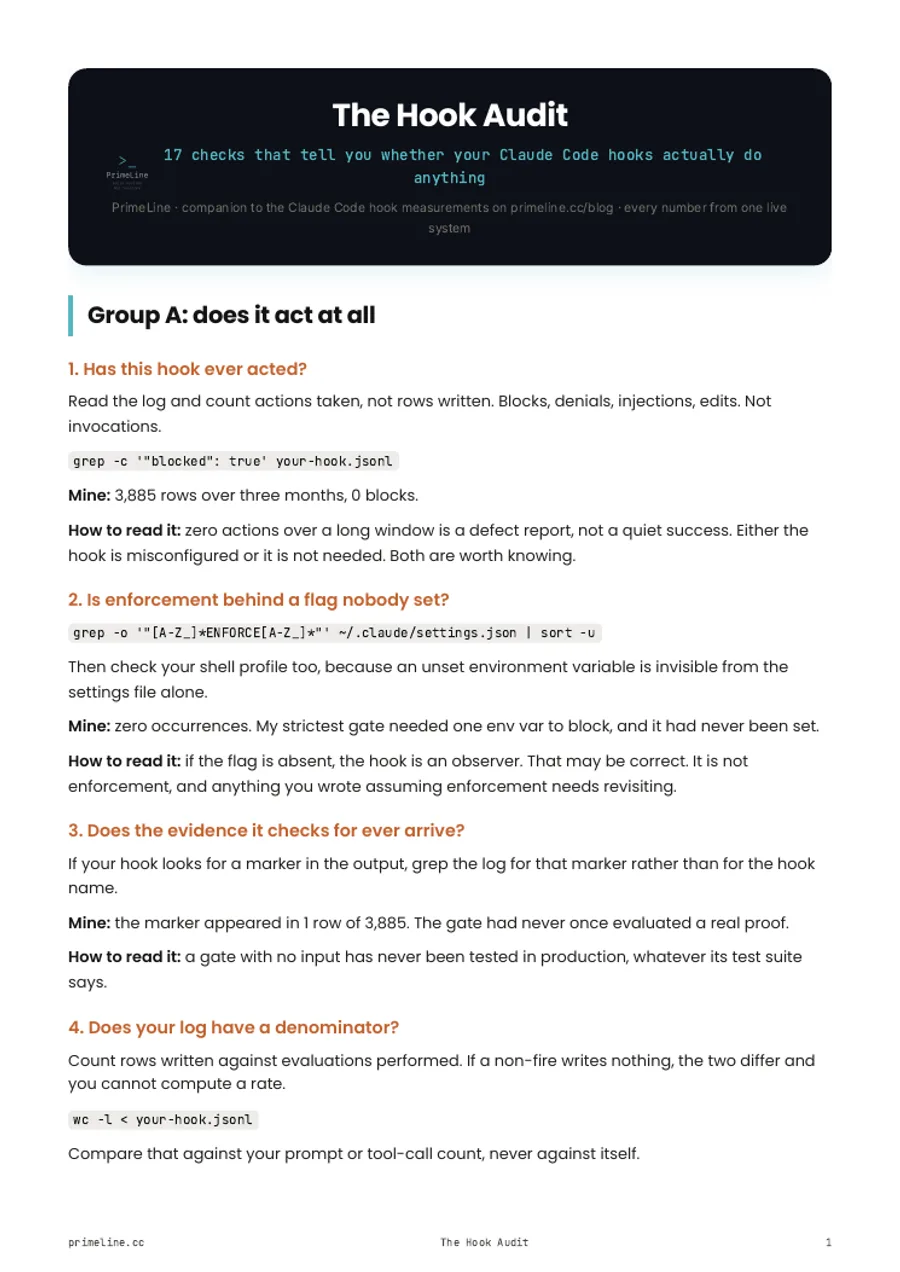
All seventeen checks, each with the exact command, my own number as a worked example, and how to read your three possible answers. Including the two that killed a finding of mine.
Download the PDFGive every check three states instead of two, so "could not determine" stops being encoded as "fine". Then measure consumption once, because delivery is easy and it is not the question.
The hooks, context router and session memory I run this against live in primeline-ai/evolving-lite. Clone it and the hooks are wired on install. If you want the layer underneath, session management and knowledge architecture cover how the pieces fit, and self-correcting workflows is where I first wired the PreToolUse hook that started all of this.
Honest limits
One system, mine, measured over three to four months. The path-dependence figure is one hook, one user, 303 observable injections across 68 sessions. Do not quote it as a general finding about Claude Code hooks.
What transfers is the method, not the numbers. Join fires to outcomes instead of counting fires. Re-derive anything that becomes load-bearing, on more data than you first measured it on. And before you trust a guard, try to break it on purpose.
The advice that got me here was right: Anthropic's docs say CLAUDE.md is context rather than enforced configuration, and a hook is the answer to that. Moving the rule into code was the correct first step. I spent three months believing it was the last one.